Firmographic Data
How to Use Firmographic Segmentation for ABM Campaigns That Actually Convert

Quick Answer
Firmographic segmentation for ABM is the process of grouping target accounts by shared company-level characteristics industry, headcount, revenue, growth stage, geography, and legal structure to determine which accounts belong on your target list and how to prioritize them. When done correctly, it tells your sales and marketing teams not just who to reach, but what to say and when to say it. When done poorly using too few variables, stale data, or segments that are too broad it produces target lists that look complete but convert at a fraction of their potential.
The Real Problem with ABM Target Lists
Most account-based marketing programs fail before a single email is sent. Not because the messaging is wrong. Not because the product is a bad fit. They fail because the target list was built on guesswork.
Ask a revenue team how they built their target account list and you will usually hear something like this: “We filtered by industry and company size in our CRM, pulled accounts over a certain revenue threshold, and added a few names from our sales team.” That process is not firmographic segmentation. It is a spreadsheet with a couple of filters applied. The difference matters enormously.
True firmographic segmentation for ABM combines multiple company-level variables weighted by their predictive power, validated against your actual win history, and refreshed at a cadence that reflects how fast company data changes. It also looks completely different depending on whether you are running a 1:1, 1: few, or 1: many program. A Tier 1 campaign targeting 20 named enterprise accounts needs a different level of data depth than a Tier 3 campaign touching 1,500 mid-market accounts.
This blog covers what most guides on this topic do not: the hierarchy of firmographic variables, the segmentation mistakes that silently drain pipeline, how to size a segment correctly, and the six questions every team should answer before committing budget to any segment.
Section 1: What Firmographic Segmentation Actually Means for ABM Teams
Firmographic data describes the structural characteristics of a company the attributes that define what kind of organization it is, how large it is, where it operates, and how it is structured legally and financially. These are the B2B equivalent of demographic data. Just as consumer marketers segment individuals by age, income, and location, B2B marketers use firmographic attributes to understand accounts at the company level.
In an ABM context, firmographic segmentation serves a specific purpose: it tells you which accounts belong on your target list and how to group them for personalized outreach. Without this foundation, every other part of your ABM program your messaging, your channel mix, your content is aimed at a poorly defined target.
The core firmographic variables used in B2B segmentation are industry or vertical, company headcount, annual revenue, growth stage, geographic location, legal status (public vs. private, standalone vs. subsidiary), and to a lesser extent, the density and titles of senior executives. None of these variables is equally useful in every situation and combining them intelligently is what separates a high-performing target list from a list that generates activity but not revenue.
One important correction worth making here: sales cycle stage is not a firmographic variable, despite occasionally appearing in lists like this. Sales cycle stage is a CRM or behavioural attribute it reflects where a company is in your pipeline, not what kind of company it is. Mixing CRM data with firmographic data creates confusion at the segmentation level and leads to targeting decisions that are reactive rather than strategic.
Section 2: The Hierarchy of Firmographic Variables Not All Fields Carry Equal Weight
The biggest gap in most firmographic segmentation approaches is treating all variables as equally important. They are not. Some variables have strong predictive power for identifying accounts that will convert. Others are useful for filtering, but weak as standalone indicators of fit. Understanding the difference changes how you build your segments.
The table below ranks the eight core firmographic variables by their predictive power for ABM fit and includes the data decay rate for each which tells you how often that data goes stale.
| Firmographic Field | Predictive Power | Best Used For | Data Decay Rate |
|---|---|---|---|
| Industry (vertical) | Very High | Messaging, content, pain point alignment | Low (2–5%/yr) |
| Company size (headcount) | High | Tier assignment, product fit, deal size | Medium (8–12%/yr) |
| Annual revenue | High | Budget qualification, pricing tier match | Medium (10–15%/yr) |
| Growth stage | High | Timing of outreach, urgency signals | High (20–25%/yr) |
| Geography / HQ location | Medium | Territory assignment, compliance filters | Low (3–6%/yr) |
| Legal status (public/private) | Medium | Procurement complexity, deal cycle length | Low (5–8%/yr) |
| Subsidiary vs. standalone | Medium | Decision-maker mapping, org complexity | Medium (10–12%/yr) |
| Executive title density | Lower alone | Contact targeting within a qualified account | High (25–30%/yr) |
A few things stand out in this table. Industry vertical and company size together carry the most predictive weight, which is why leading data providers treat these as the primary segmentation layer. Growth stage has high predictive power but also decays quickly a company that was a Series B startup 18 months ago may be a 400-person organization today with completely different buying behaviour and a different decision-making structure.
Executive title density the number of senior decision-makers at a given level is listed last, not because it lacks value, but because it is only meaningful once the account itself has been qualified. Knowing that a target company has three VPs of Marketing tells you who to contact, but it does not tell you whether the company is a fit in the first place. Title targeting without firmographic qualification underneath it is a common reason ABM campaigns have strong open rates but low conversion.
The practical implication: build your segments on the top four fields industry, company size, revenue, and growth stage and use the remaining fields to refine and filter within those segments, not to build the segment from scratch.
Section 3: The Goldilocks Segment Problem
There is a specific mistake that sits at the heart of most failed ABM programs: the segments are sized wrong. Either they are too broad and produce a list of thousands of accounts with nothing meaningful in common beyond a few surface-level filters, or they are too narrow and leave you with 12 accounts and no real pipeline capacity.
Both extremes produce the same result: low conversion. Broad segments fail because the messaging required to speak to every account in the list becomes generic. Narrow segments fail because there are not enough accounts to generate meaningful revenue, no matter how precise the targeting is.
Getting this right is not a matter of guesswork. There is a practical way to think about segment sizing that most teams never apply:
- Start with your average deal size and your revenue target for the program
- Work backward using a realistic conversion rate for your ABM tier (1:1 program typically convert between 15–25% of target accounts to pipeline)
- The resulting number tells you how many accounts the segment needs to hold at minimum
- Build up from there to account for disqualification during outreach and data gaps
As a rough benchmark: a Tier 3 program needs at minimum 300–500 qualified accounts per segment to generate consistent pipeline. A Tier 2 program can work with 75–200. A Tier 1 program can operate with as few as 10–15, but each account in that segment must be researched individually and treated as its own micro-campaign.
Watch Out
The most common version of the Goldilocks problem looks like this: a team builds a “Financial Services” segment, adds a headcount filter of 500+, and ends up with 2,400 accounts. At that volume, personalization collapses. You cannot write personalized outreach to 2,400 companies. What the team has built is a mass email list wearing an ABM label. Adding one more firmographic filter revenue above $50M, or Series C and later, or headquartered in North America typically reduces that list to a workable 200–400 accounts without sacrificing the meaningful volume needed for pipeline.
Section 4: Segmentation Depth by ABM Tier
Firmographic segmentation does not look the same at every level of an ABM program. The amount of data you need, the number of variables you layer, and how often you refresh the data all change depending on which tier you are running.
Most teams either over-engineer their Tier 3 segments (spending time gathering data they will never use at that scale) or under-engineer their Tier 1 segments (treating named enterprise accounts the same way they would treat a Tier 3 nurture list). The table below outlines what segmentation actually looks like at each tier.
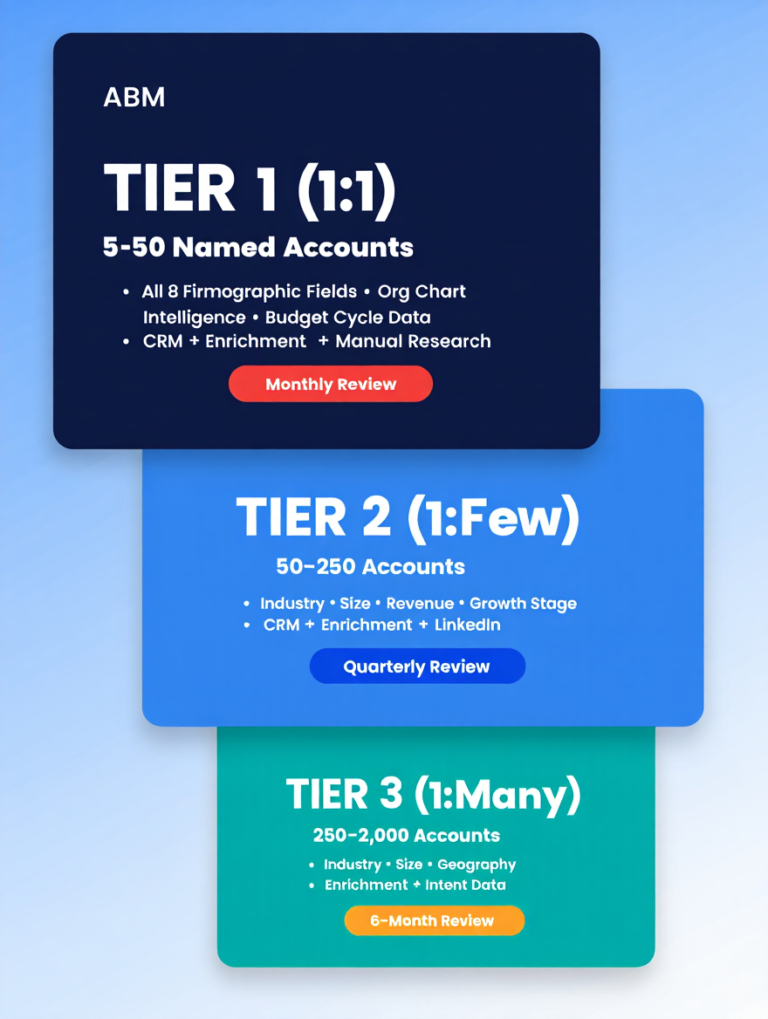
| ABM Tier | Accounts | Firmographic Depth Needed | Data Sources Required | Segment Review Cadence |
|---|---|---|---|---|
| Tier 1 (1:1) | 5–50 named accounts | All 8 fields + org chart + budget cycle | CRM + 3rd-party enrichment + manual research | Monthly |
| Tier 2 (1: few) | 50–250 accounts | Industry + size + revenue + growth stage | CRM + enrichment provider + LinkedIn Sales Nav | Quarterly |
| Tier 3 (1: many) | 250–2,000 accounts | Industry + size + geography minimum | Enrichment provider + intent data overlay | Every 6 months |
A few practical notes on this framework. For Tier 1 accounts, firmographic data alone is not enough you need org chart intelligence to understand the reporting structure, budget ownership, and decision-making path within each account. Firmographic data tells you the company is a fit; the org intelligence tells you who inside that company controls the decision.
For Tier 3, the risk is different. At that scale, the danger is relying on a single enrichment source that has not been refreshed in six months. Given that growth stage data decays at 20–25% per year, a Tier 3 list built in January and left untouched until September has likely degraded enough that 10–15% of the accounts no longer match the segment criteria. That translates directly to wasted spend.
The segment review cadence in the table is not aspirational it is the minimum required to keep firmographic data actionable. Building a quarterly review into your ABM calendar is not overhead; it is pipeline protection.
Section 5: Ghost Segments When Firmographic Fit Doesn't Mean Buying Intent
Here is a situation most ABM practitioners have encountered: a segment looks perfect on paper. The industry is right, the company size fits, the revenue aligns with your deal size, the growth stage matches your best customers. But outreach goes cold. Sequence completion rates are normal but replies are flat. The accounts open emails and disappear.
These are ghost segments accounts that are firmographically qualified but behaviourally disengaged. They fit your ICP, but they are not in market. And firmographic data alone gives you no way to tell the difference between an account that fits and is actively evaluating solutions, and an account that fits but renewed their current contract six months ago and has zero budget authority to change anything for 18 months.
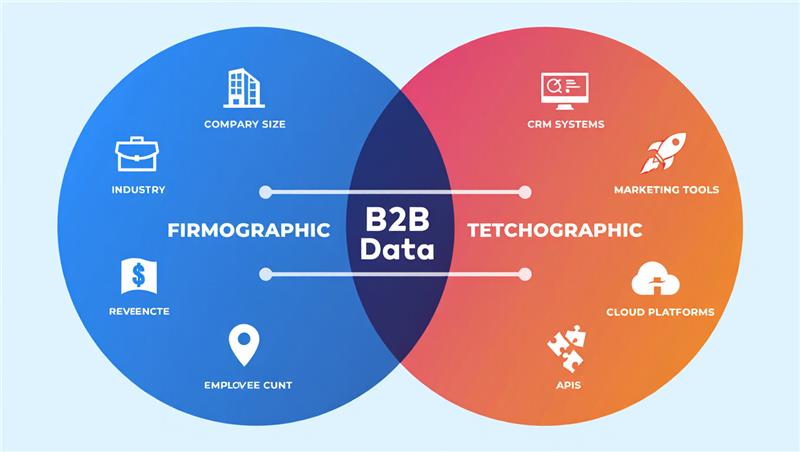
The fix is not to abandon firmographic segmentation it is to recognize that firmographic data answers the question “does this account fit?” but not the question “is this account ready?” Answering that second question requires layering in at least one additional data type. Technographic data the software and tools a company currently uses is particularly useful here, because specific technology combinations signal both the presence of a problem and the stage of the buying process.
A company using a legacy CRM with no marketing automation layer is at an earlier stage of digital maturity than a company running Salesforce, Marketo, and a data warehouse. Both companies might be firmographically identical. Only the technographic layer tells you which one is closer to the decision you are trying to influence. This is covered in depth in our guide on firmographic vs technographic data and it is worth reading before building any ABM segment that targets technology buyers.
For now, the practical rule is: build firmographic segments first to define the universe of qualified accounts, then apply a technographic or intent filter to identify the subset that is actively in-market. Run your highest-investment outreach at that in-market subset and keep the broader firmographic segment on a lower-touch nurture track.
Section 6: Data Decay and the Hidden Cost of Stale Firmographic Segments
Firmographic data has a shelf life, and that shelf life is shorter than most teams assume. Companies get acquired, restructure departments, change their legal status, raise new funding rounds, downsize headcount, open new offices, and close old ones constantly. The data you used to build a segment six months ago is a different picture of those companies than the reality on the ground today.
The decay rates in the earlier table are not theoretical. Growth stage data is the most volatile: a company that raised a Series A when you last enriched your data may have raised a Series C, doubled headcount, and moved upmarket into an entirely different competitive environment. Chasing that company with messaging designed for a scrappy startup is not just ineffective it signals that you have not done your homework, which is exactly the impression you cannot afford to make in enterprise ABM.
Revenue and headcount data decay more slowly but still meaningfully. An average mid-market company changes headcount by 8–12% annually through hiring and attrition alone. A company that had 150 employees when you built your segment may now have 220 which could push it into a different pricing tier, a different product fit, or a different decision-making structure.
The practical response to data decay is not to refresh every record constantly that is operationally expensive and unnecessary. The response is to tier your refresh cadence to match the decay rate of the data and the investment level of the ABM tier it feeds. Tier 1 accounts should be reviewed monthly at minimum, because you are investing significant resources in personalized content and outreach for each one. Tier 3 accounts can be reviewed every six months, but do not skip the review.
One specific data point that most teams miss: company email domain changes which happen when companies rebrand or are acquired invalidate every contact record associated with that domain in your CRM. This is not a minor housekeeping issue. If your email sequences are firing at domain addresses that no longer exist, your deliverability scores suffer at the account level, and your outreach metrics look artificially poor. Data cleansing and verification processes exist precisely for this reason and the cost of not running them is measured in pipeline, not just data quality scores.
Section 7: Building the Sequence ICP First, Then Segments
There is a sequencing mistake that produces bad segments from the start: building firmographic segments before you have defined what a win looks like for each segment. The correct order is to define your Ideal Customer Profile first, validate it against your closed-won history, and then build firmographic segments that reflect that validated ICP.
What this means in practice: pull your last 30 closed-won deals. Identify the firmographic characteristics they share not the characteristics you wish they shared, but the ones that actually appear in your best customers. Look for patterns across at least three variables simultaneously. A deal closed with a 200-person SaaS company in the financial services vertical with $20M–$50M in revenue means something different from a deal closed with a 200-person company in a different vertical at the same size. The industry variable may matter more than the size variable for your specific product.
- Analyses your last 20–30 closed-won deals for shared firmographic traits
- Identify which variable combinations not single variables appear most consistently
- Check whether your top-performing accounts by LTV share traits that your average accounts do not
- Use those patterns as the basis for your primary segments, not your assumptions about who should be a good customer
This process also surfaces something important: accounts that closed for reasons unrelated to your ICP. If five of your 30 closed-won deals came through a single partner channel and all happened to be in a vertical you do not otherwise serve well, including those in your firmographic analysis will distort your segments. Clean the data before you build from it.
Section 8: The 6-Question Segment Validation Framework
Before any firmographic segment receives budget, it should pass a basic validation test. This is not a lengthy audit it is six questions that take about 30 minutes to answer honestly and that prevent the common failure modes described in this blog.
| Validation Question | Why It Matters |
|---|---|
| Does this segment have at least 50 accounts (Tier 3) or 10 accounts (Tier 2)? | Volume check – too narrow = no pipeline to fill |
| Do your last 20 closed-won deals share at least 3 firmographic traits with this segment? | Fit validation – segments should reflect actual wins, not assumptions |
| Can your sales team describe a specific pain point this segment shares without prompting? | Messaging readiness – if sales can't articulate it, the segment is too vague |
| Has the firmographic data in this segment been verified in the last 90 days? | Data freshness – stale segments produce cold outreach to wrong accounts |
| Does this segment have intent signal overlap (technographic, web activity, or content consumption)? | Buying signal check – firmographic fit alone is not enough |
| Is there a named owner responsible for this segment's pipeline performance? | Accountability – segments without owners drift and go stale |
The purpose of this framework is to create a decision gate between segment creation and budget allocation. Most teams skip this step because building the segment feels like progress, and adding a validation layer feels like slowing down. The reality is the opposite: a segment that fails one of these questions will cost you more in wasted spend than the time it takes to answer them before launching.
The sixth question whether there is a named owner for the segment deserves particular emphasis. Firmographic segments drift. Data decays, accounts get disqualified, messaging gets stale. Without a named owner responsible for reviewing and refreshing the segment, the drift goes unnoticed until pipeline numbers force the conversation. Assign ownership at the segment level from day one.
Key Takeaways
- Firmographic segmentation is not about applying filters to a list it is about identifying which company-level attributes predict fit and using them in combination to build target account lists that reflect your actual win history.
- Not all firmographic variables carry equal predictive power. Industry, company size, revenue, and growth stage are the primary building blocks. Title targeting and geography are refinement layers, not segment foundations.
- The Goldilocks Segment problem segments too broad to enable personalization, or too narrow to generate pipeline is the most common cause of ABM programs that produce activity but not revenue.
- Segmentation depth must match your ABM tier. Tier 1 campaigns require org chart intelligence and monthly data review. Tier 3 campaigns need a minimum of three firmographic filters and a semi-annual refresh.
- Ghost segments accounts that are firmographically qualified but not in-market are invisible until outreach metrics go flat. Layering technographic or intent data on top of firmographic segments is the only reliable way to identify the in-market subset.
- Data decay is a structural problem, not a one-time data quality issue. Growth stage data decays at 20–25% per year. Without a documented refresh cadence, segments built this quarter will be materially inaccurate within six to nine months.
- Run the 6-question validation framework on every segment before committing budget. The questions take 30 minutes to answer and prevent the most common segment failures.
Frequently Asked Questions
Firmographic segmentation is the practice of grouping B2B accounts by shared company-level attributes industry, headcount, annual revenue, growth stage, geography, and legal structure to determine which accounts to target and how to prioritize outreach. In an ABM context, it forms the first layer of account qualification, answering whether a company belongs on your target list before behavioural or intent signals tell you whether it is ready to buy.
Industry vertical, company size by headcount, annual revenue, and growth stage carry the highest predictive power for identifying accounts that will convert in ABM programs. These four variables together reflect the structural fit between an account and your product far more reliably than any single variable in isolation. Geography, legal status, and executive title density are useful as secondary filters but should not be used as primary segmentation criteria without the four core fields underneath them.
Refresh cadence should match both the decay rate of the data and the investment level of the ABM tier it feeds. Tier 1 (1:1) segments should be reviewed monthly because the investment per account is high. Tier 2 segments should be reviewed quarterly. Tier 3 segments should be reviewed every six months at minimum. Growth stage data the fastest-decaying firmographic variable at 20–25% per year should be re-verified at every review cycle regardless of tier.
An Ideal Customer Profile (ICP) defines the characteristics of your best-fit accounts in aggregate. Firmographic segmentation takes that ICP and uses it to build specific, actionable account lists by filtering your total addressable market through the firmographic criteria your ICP describes. ICP definition is a strategic exercise. Firmographic segmentation is the operational execution of that strategy. Both are necessary, and the ICP should always be validated against closed-won history before firmographic segments are built from it.
This is the ghost segment problem: the accounts in the segment are firmographically qualified but not in-market. Firmographic data tells you whether an account fits your ICP, but it tells you nothing about timing. Accounts that recently renewed contracts, are in budget freeze periods, or are not actively evaluating solutions will engage with outreach superficially and then go cold. Solving this requires layering technographic or intent data on top of the firmographic segment to identify the subset of accounts that are actively in the buying process.
A minimum of three and ideally four primary variables. Using only one or two variables produces segments that are too broad to enable meaningful personalization. Using more than six variables at the primary segment level often produces segments that are too narrow to generate sufficient pipeline volume. The practical approach is to build segments around three to four core variables industry, size, revenue, and growth stage being the most predictive combination and apply additional variables as sub-filters within segments rather than as top-level segment criteria.

Conclusion
Firmographic segmentation is not a setup task you complete once before launching an ABM program. It is an ongoing data practice that shapes every decision downstream who gets outreached, with what message, at which investment level, and through which channels. Get the segments wrong and everything built on top of them underperforms regardless of how strong the messaging or creative is.
The teams that consistently build high-converting ABM programs treat firmographic data as a living asset rather than a static list. They validate segments against their own win history before spending budget, they refresh data at a cadence that matches how fast company attributes change, and they understand which data layers firmographic, technographic, intent answer which questions about their target accounts.
If you are starting from scratch, the most valuable first step is not choosing a data provider or building a target list. It is pulling your last 30 closed-won deals and identifying the firmographic patterns that define your best customers. That single exercise will produce better segment definitions than any template or framework because it reflects the specific market reality of your product, your sales motion, and your competitive position.
Right Pace Techmedia Editorial Team
Right Pace Techmedia editorial team comprises B2B growth specialists and campaign strategists with over 7 years of hands-on experience delivering measurable pipeline results for globally recognized technology brands including Oracle, SAP, Salesforce, Siemens, and Lenovo. Having engineered over 1.8 million verified leads across lead generation, account-based marketing, data intelligence, and demand generation programs, our writers draw from real campaign outcomes not borrowed theory. Every article published on this blog reflects practitioner-level knowledge, reviewed by senior professionals who have managed complex B2B campaigns across industries, geographies, and buying committee structures. We write what we know because we’ve lived it.
Our Latest Bolgs

Firmographic and Technographic Data for B2B SaaS ICP
Firmographic Data How to Use Firmographic and Technographic Data to Define Your ICP for B2B SaaS Quick Answer To build an ICP
Firmographic Segmentation for ABM
Firmographic Data How to Use Firmographic Segmentation for ABM Campaigns That Actually Convert Quick Answer Firmographic segmentation for ABM is the process
Firmographic vs Technographic Data: What B2B Teams Get Wrong About Both
Firmographic Data Firmographic vs Technographic Data: What B2B Teams Get Wrong About Both Quick Answer: Firmographic data tells you who a company


