Firmographic Data
How to Use Firmographic and Technographic Data to Define Your ICP for B2B SaaS

Quick Answer
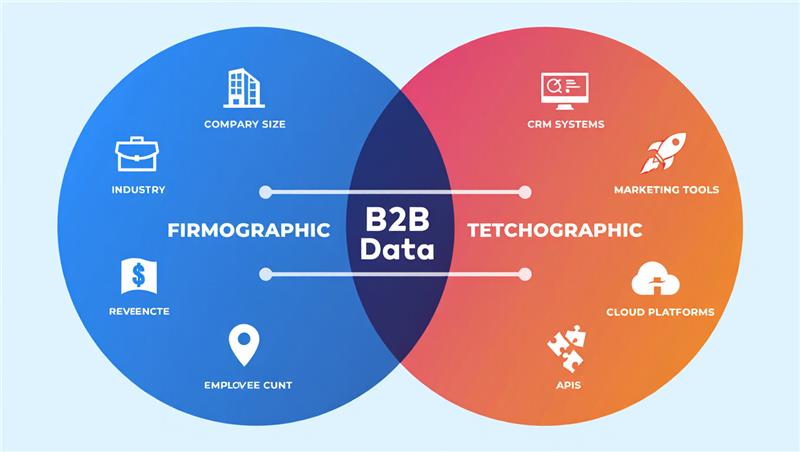
To build an ICP that converts, you need two layers of data working together. Firmographic data things like industry, headcount, revenue, and growth stage tells you which companies are the right structural fit for your product. Technographic data the software and tools a company already uses tells you which of those companies are operationally ready to buy. Use only one of these and your ICP will look complete on paper but underdeliver in practice. Use both and you narrow your target list down to the accounts most likely to close, stay, and grow.
The ICP Problem Most SaaS Teams Don't Talk About
Most B2B SaaS companies have an ICP document. It lives in a shared folder, gets mentioned in onboarding decks, and gets updated roughly once a year during planning season. It usually describes the ideal company size, a couple of industry verticals, a revenue range, and a note about the type of buyer something like “VP of Marketing at a mid-market SaaS company.”
That document is a fine starting point. It’s a poor finishing line.
The problem isn’t that teams don’t have an ICP. It’s that the ICP they have is based on gut feel, a handful of early customer stories, and a few sales calls not on a careful look at what their best accounts look like in the data.
The result is a target list full of companies that match the description on paper but behave very differently in practice. Some close in 30 days. Others go through six months of evaluation and go quiet. Others get excited, then renew with their existing vendor. Firmographic data alone can’t tell these three groups apart. Technographic data combined with the right firmographic filters can.
This post walks through how to build a B2B SaaS ICP using both data types correctly, what the combination reveals that neither type can show on its own, and the specific mistakes that cause ICPs to underperform even when teams think they’ve done the work.
What Each Data Type Tells You and What It Can't
Before combining firmographic and technographic data, it helps to be clear about what each one answers. They work well together because they answer different questions about the same account.
Firmographic data answers: Does this company fit?
Firmographic data describes the basic facts about a company what kind of business it is. For B2B SaaS, the most useful firmographic signals are industry, company size (headcount), annual revenue, and growth stage. Secondary signals include location, legal structure, and how the organisation is set up.
These fields tell you whether a company belongs in your addressable market. A 800-person financial services firm with $50M in annual revenue either fits your product’s pricing and complexity level, or it doesn’t. Firmographic data lets you make that call quickly and at scale.
What it can’t tell you: whether that company’s tech setup is compatible with yours, whether they’re actively looking to buy, or whether they’re already locked into a competitor. Two companies can look identical on firmographic criteria and be at completely different stages of the buying journey.
Technographic data answers: Is this company ready?
Technographic data covers the software and tools a company is already using. For SaaS targeting, this includes their CRM, marketing automation platform, data infrastructure, cloud environment, security tools, and collaboration software. Each of these tells you something specific about how mature the company is operationally and how ready they are to buy.
A company running Salesforce Enterprise, Marketo, and a modern data warehouse is at a very different stage than a company managing sales in spreadsheets and sending emails through a basic tool. Both might look identical firmographically same size, same industry, same revenue. Only the technographic layer tells you which one is closer to being ready to move.
What it can’t tell you: whether the company has the budget, the headcount, or the right structure to be a strong long-term customer. Technographic data tells you about operational readiness. Firmographic data tells you about structural fit. You need both.
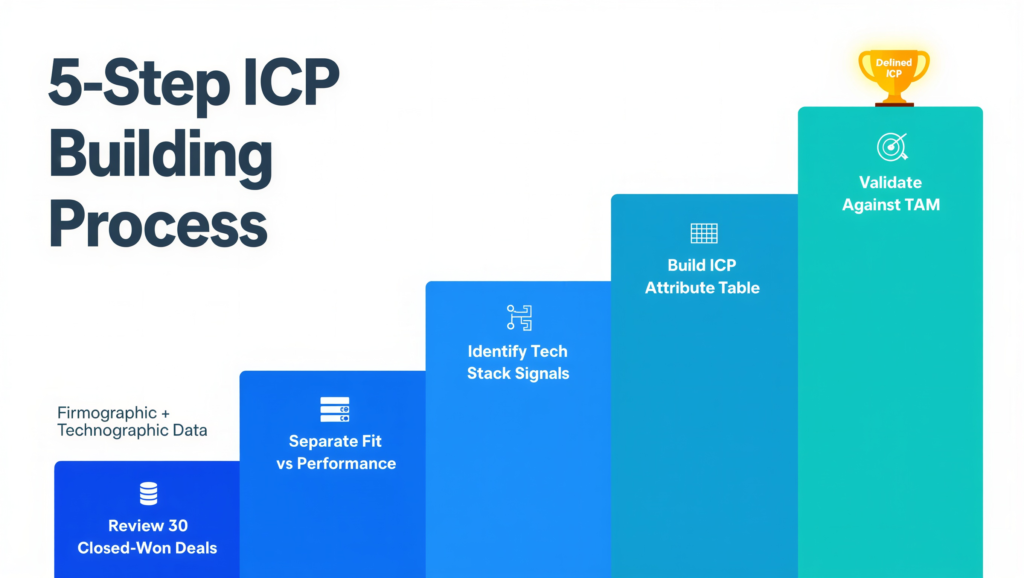
The Five-Step ICP Building Process
This process is built around one principle: every ICP attribute should be checked against your actual closed-won data before you include it. Attributes that feel right but don’t consistently appear in your best customers are assumptions, not ICP criteria.
Step 1: Review your last 30 closed-won deals
Pull every deal closed in the last 12 to 18 months. For each one, note the firmographic profile industry, headcount, revenue, growth stage, location and the technographic profile what CRM, marketing automation tool, data tools, and infrastructure they were using at the time of the sale. Look for patterns across at least three variables at once, not just individual fields.
This exercise almost always turns up something unexpected. The ICP you think you have and the ICP your best customers represent are rarely the same thing. Common discoveries: the revenue range is off by 40%, the industry spread is narrower than assumed, or one specific combination of tools shows up in 70% of your fastest-closing deals.
Step 2: Separate fit from performance
Not all closed-won deals are equal. A deal that closed in 28 days, renewed at 120% NRR (meaning the customer spent more than they originally paid), and expanded across two teams is a very different signal than a deal that took nine months, churned after 14 months, and needed three times the usual implementation support.
Separate your closed-won data by deal quality time to close, renewal rate, expansion, support cost and find the firmographic and technographic patterns that show up most often in your highest-quality customers, not just your largest contracts. This step separates your ICP (who you want to keep winning) from your customer list (everyone who has bought).
Step 3: Find the tech signals that predict fast closes
Within your closed-won data, look specifically at the tech stack of your fastest-closing deals. For most B2B SaaS products, a specific combination of existing tools predicts close speed better than any firmographic variable. A company already running the category of tools that connect to your product is closer to a yes than one building that infrastructure from scratch.
The exact signals vary by product, but common patterns include: a modern CRM that shows an established sales process, a data warehouse that shows analytical maturity, and the absence of a direct competitor that shows an open evaluation. Map these patterns before you build your ICP filter set.
Step 4: Build the combined ICP attribute table
Turn the patterns from Steps 1 to 3 into a structured ICP definition with two layers firmographic qualification criteria and technographic readiness criteria. Both layers must be present for an account to qualify as a target. The table in Section 3 shows what this looks like for three common SaaS product types.
Step 5: Check the ICP against your total addressable market
Before you finalise the ICP, run the combined criteria against your total addressable market to see how many accounts it produces. An ICP that generates 12,000 qualified accounts across your target markets is workable. One that generates 180 is too narrow for a scalable sales and marketing motion unless you’re running a pure enterprise 1:1 ABM programme.
If the segment is too narrow, identify which criteria are cutting too deep. Usually, it’s a single technographic variable. Adjust that one first.
Summary
You can tailor messaging based on an account’s existing technology stack.
Sample ICP Attribute Table for B2B SaaS
The table below shows what a combined firmographic and technographic ICP looks like across three common SaaS product types. These are illustrative examples your own criteria should always be validated against your closed-won data as described in Section 2.
| Attribute | Sales Intelligence SaaS | Marketing Automation SaaS | Data Infrastructure SaaS |
|---|---|---|---|
| Industry | B2B SaaS, IT Services, Professional Services | SaaS, eCommerce, Media, Financial Services | SaaS, Fintech, Healthcare Tech, Logistics |
| Headcount | 100–1,000 employees | 50–500 employees | 200–2,000 employees |
| Annual Revenue | $10M–$100M ARR | $5M–$50M ARR | $20M–$200M ARR |
| Growth Stage | Series B to D (or equivalent revenue growth) | Series A to C | Series C and above, or profitable scaleup |
| Geography | North America, UK, DACH, ANZ | North America, Western Europe | North America, Europe, Singapore |
| Current CRM | Salesforce or HubSpot shows an established sales team | HubSpot or Marketo shows marketing maturity | Salesforce shows sales complexity and data volume |
| Marketing Automation | Any marketing automation tool present shows lead gen maturity | No tool or a basic one signals a replacement opportunity | Marketo or Eloqua shows complex campaign needs |
| Data Infrastructure | No requirement — your product provides this layer | GA4 and basic CRM only signals gap in attribution | Snowflake, Big Query, or Databricks already in place |
| Cloud Environment | AWS or GCP shows modern infrastructure | AWS or Azure standard requirement | AWS or GCP required for integration compatibility |
| Competitor Signals | Not currently using ZoomInfo or Apollo | Currently using Mailchimp or a basic email tool | No active Fivetran or dbt contract in place |
The competitor signals row is worth paying particular attention to. Knowing whether a prospect is already contracted with a direct competitor or using a tool your product replaces changes your entire outreach approach.
A prospect with no current solution needs to be educated on the category. A prospect already using a competitor needs to be shown why switching makes sense. Both are valid targets, but they need completely different messages and a different sales motion. Technographic data is the only way to tell them apart at scale before your SDR makes the first call.
Real SaaS ICP Examples
Example 1: Revenue Intelligence Platform
A revenue intelligence SaaS targeting mid-market B2B companies built its original ICP around a simple firmographic filter: 100 to 500 employees, in SaaS or IT services, with a sales team of at least 15 people. Outreach was generating demos, but close rates were poor and sales cycles were long.
After reviewing their closed-won data, the team spotted a clear technographic pattern in their best customers: every fast-closing, high-retention account was already running Salesforce with more than 50 active users and had a dedicated sales operations function. Companies on HubSpot or a lighter CRM were closing at half the rate and churning at 18 months twice as often.
Adding a single technographic filter Salesforce Enterprise with 50+ users reduced the target list by 35%. But the average close rate climbed from 18% to 31%, and the average sales cycle dropped from 74 days to 44 days. The firmographic criteria stayed the same. The technographic filter did the work.
Example 2: B2B Content Intelligence Platform
A content intelligence SaaS targeting demand generation teams was getting strong inbound traffic but poor conversion from marketing-qualified leads (MQLs) to sales-qualified leads (SQLs). Marketing was celebrating pipeline numbers. Sales was turning down 60% of those leads within two calls.
The ICP analysis revealed the disconnect marketing was using firmographic filters only SaaS companies, 50 to 300 employees, Series A to C. Sales, through hard experience, had learned that prospects without a dedicated content team and an existing marketing automation tool almost never converted. But that technographic insight wasn’t captured anywhere in the ICP document it was invisible there, even though it appeared in every lost deal review.
Adding technographic filters for marketing automation presence and at least two active content publishing tools reduced MQL volume by 40%. But MQL-to-SQL conversion jumped from 22% to 47%. Sales and marketing alignment improved immediately because they were finally looking at the same ICP.
Example 3: Data Pipeline Automation Platform
A data infrastructure SaaS had a precise firmographic ICP Series C and above, 200 to 1,500 employees, in SaaS or fintech. Outreach to this segment was generating interest, but deals kept stalling at the technical evaluation stage because the prospect’s engineering team wasn’t ready to implement the product.
Technographic analysis of closed-won deals revealed a consistent pattern: every account that closed and implemented successfully was already running a modern cloud data warehouse Snowflake, BigQuery, or Databricks before the sale. Accounts without a data warehouse were interested in the concept but rarely had the internal capability to implement within a reasonable timeframe.
The team added a data warehouse presence filter to their ICP. Target list volume dropped by 50%. But average implementation time fell from 11 weeks to 4 weeks, customer satisfaction in the first 90 days improved significantly, and 12-month churn dropped because customers who were technically ready to use the product were getting value much faster.
Six ICP Mistakes That Quietly Kill Pipeline
Mistake 1: Building the ICP from sales opinions rather than closed-won data
Sales teams have strong instincts about ideal customers, but those instincts reflect the deals they remember most, not the deals that are statistically representative. One large enterprise deal that took 18 months to close will shape a team’s ICP thinking far more than ten smaller deals that closed in 30 days. Start with data. Then validate it with sales experience.
Mistake 2: Using firmographic criteria only and calling it an ICP
An ICP built entirely on firmographic attributes is really just a description of your addressable market it tells you who could buy, not who is positioned to buy now. Every B2B SaaS ICP should include at least two technographic readiness criteria alongside the firmographic filters.
Mistake 3: Setting technographic criteria based on what you expect to see, not what your data shows
A common version of this: a SaaS founder assumes their best customers are the most technically advanced companies in the segment the ones running the largest, most modern tool stacks. The closed-won data often tells a different story. Companies in the middle of a technology transition are frequently better customers than the most mature ones, because they’re actively investing in improvement. Let the data define the technographic profile. Don’t let assumptions override it.
Mistake 4: Never refreshing the ICP as the product evolves
A SaaS product at Series A serves a different customer than the same product at Series C. As your product adds enterprise features, raises pricing, and builds integrations, the ICP shifts. Teams that built their ICP in 2022 and haven’t touched it since are targeting a version of their market that may no longer exist. Review the ICP at minimum once a year and after every major product release or pricing change.
Mistake 5: Giving only firmographic data to marketing and only technographic signals to sales
This is more common than it should be. Marketing uses firmographic filters for campaign targeting. Sales uses technographic signals to qualify on calls. Neither team has the full picture. The result: marketing generates leads that are firmographically right but technographically unready, and sales rejects them as low quality. A shared ICP document that includes both layers visible to both teams removes this structural disconnect.
Mistake 6: Treating ICP as binary in or out
Not every account that meets your ICP criteria deserves the same level of attention. An account that hits all firmographic criteria and shows three positive technographic signals is a fundamentally different priority than one that meets two of five firmographic filters and shows one weak technographic signal. Build a tiered ICP Tier 1 for full matches, Tier 2 for partial matches, Tier 3 for long-term nurture and calibrate your outreach investment accordingly.
Data Tools That Support This Process
Building a combined firmographic and technographic ICP requires reliable data sources for both layers. The tools below cover the main options across different budgets and use cases.
| Tool | Best For | Firmographic Coverage | Technographic Coverage |
|---|---|---|---|
| ZoomInfo | Enterprise prospecting and enrichment | Strong industry, size, revenue, org chart | Good tech stack and install-base data |
| Clearbit | Real-time CRM enrichment and scoring | Strong all primary firmographic fields | Moderate tech stack at company level |
| Bombora | Intent data with firmographic overlay | Moderate basic firmographic fields | Weak alone best paired with ZoomInfo |
| HG Insights | Technographic specialisation | Basic | Very strong 40,000+ tracked technologies |
| BuiltWith | Website technology detection | Very basic | Strong for web-facing technologies |
| Right Pace TechMedia | Verified firmographic + technographic data for ICP targeting | Strong verified, enriched, refreshed | Strong matched to your ICP and validated |
| LinkedIn Sales Navigator | Account research and contact targeting | Moderate headcount, industry, geography | Weak self-reported technology only |
One practical note on tool selection: the most common mistake is buying a technographic data subscription without first getting clean firmographic data into the CRM. Technographic filters applied to a messy contact database produce segments that are accurate at the technology level but inaccurate at the account level. Get your firmographic data clean and verified first. Then add the technographic layer on top.
Key Takeaways
- Firmographic data tells you which companies structurally fit your product. Technographic data tells you which of those companies are operationally ready to buy. A B2B SaaS ICP needs both layers to generate target lists that convert.
- Build the ICP from your closed-won data, not from sales intuition or market assumptions. Your best customers are almost always more specifically defined than you think.
- Separate deal quality from deal volume when reviewing closed-won accounts. High-retention, fast-closing, low-churn customers define the ICP. Large but difficult deals distort it.
- Technographic signals that correlate with fast closes specific CRM platforms, data warehouse presence, absence of direct competitors are more predictive than any single firmographic variable for most SaaS products.
- A shared ICP that includes both firmographic and technographic criteria, accessible to both marketing and sales, removes the structural disconnect that drives high lead volume and low conversion.
- Refresh the ICP at minimum once a year and after every major product or pricing change. Your ideal customer evolves as your product evolves.
Frequently Asked Questions
An ICP defines the type of company to target in B2B SaaS, while a buyer persona focuses on the individual within that company. The ICP guides which companies to pursue, and the persona helps you decide who to engage and how to communicate.
A practical B2B SaaS ICP usually includes three to four key firmographic criteria, such as industry, company size, revenue, or growth stage, along with two to three technographic criteria validated by closed-won data. Fewer criteria make your targeting too broad, while more than six total can make it too narrow for scalable growth unless you’re focused on enterprise ABM.
Technographic data should typically be refreshed at least every 90 days for effective ICP targeting, as technology stacks can change with funding events, leadership shifts, or vendor reviews. Faster-changing signals like growth stage should be checked during every enrichment cycle, while CRM and marketing automation data can be verified quarterly for high-priority accounts and every six months for lower-tier segments.
Yes, you can build a firmographic and technographic ICP without a large data budget, especially early on. Start by manually analyzing your last 20 closed-won accounts using LinkedIn and basic website tech lookup tools to identify patterns. Even simple tools and a spreadsheet are enough to uncover insights before investing in paid data solutions.
The most common reason B2B SaaS ICPs underperform is that they rely only on firmographic data and aren’t updated with technographic insights from closed-won accounts. Another key issue is treating the ICP as static – failing to refresh it as the product evolves, which leads to targeting the wrong accounts over time.
Technographic signals reveal which accounts are using a competitor’s product, helping sales teams identify strong displacement opportunities. This allows for targeted outreach focused on switching rather than awareness, often leading to higher close rates since the buying intent is already established.

Conclusion
The difference between a B2B SaaS ICP that generates consistent pipeline and one that generates activity without revenue almost always comes down to the same thing: one was built from data and the other was built from assumptions.
Firmographic data gives you the structural qualification layer the filter that tells you which companies belong in your addressable market. Technographic data gives you the operational readiness layer the filter that tells you which of those companies are positioned to move.
Neither layer is enough on its own. A firmographic ICP without technographic signals produces target lists that are too broad and outreach that is too generic. A technographic filter without firmographic qualification produces outreach that is technically relevant but commercially wrong reaching companies that use the right tools but are the wrong size, in the wrong industry, or at the wrong stage.
The combination, built from your own closed-won data and refreshed as your product evolves, produces something most SaaS sales teams have never experienced: a target list that sales trusts because it reflects what closes, not what looked good in a planning session.
Right Pace Techmedia Editorial Team
Right Pace Techmedia editorial team comprises B2B growth specialists and campaign strategists with over 7 years of hands-on experience delivering measurable pipeline results for globally recognized technology brands including Oracle, SAP, Salesforce, Siemens, and Lenovo. Having engineered over 1.8 million verified leads across lead generation, account-based marketing, data intelligence, and demand generation programs, our writers draw from real campaign outcomes not borrowed theory. Every article published on this blog reflects practitioner-level knowledge, reviewed by senior professionals who have managed complex B2B campaigns across industries, geographies, and buying committee structures. We write what we know because we’ve lived it.
Our Latest Bolgs
Firmographic and Technographic Data for B2B SaaS ICP
Firmographic Data How to Use Firmographic and Technographic Data to Define Your ICP for B2B SaaS Quick Answer To build an ICP

Firmographic Segmentation for ABM
Firmographic Data How to Use Firmographic Segmentation for ABM Campaigns That Actually Convert Quick Answer Firmographic segmentation for ABM is the process
Firmographic vs Technographic Data: What B2B Teams Get Wrong About Both
Firmographic Data Firmographic vs Technographic Data: What B2B Teams Get Wrong About Both Quick Answer: Firmographic data tells you who a company


