Firmographic Data
Firmographic vs Technographic Data: What B2B Teams Get
Wrong About Both
Quick Answer:
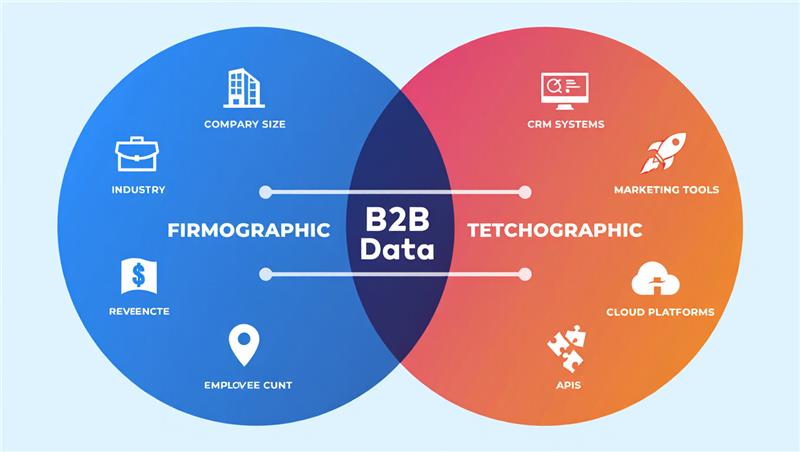
Firmographic data tells you who a company is industry, size, revenue, location. Technographic data tells you how it operates what software, infrastructure, and tools it runs on. Most B2B teams use firmographic data to build their target lists and technographic data to qualify and prioritize within them. The real edge comes not from having both, but from understanding which one to apply first, which one decays faster, and how the two together expose false positives that would otherwise waste your sales team’s time.
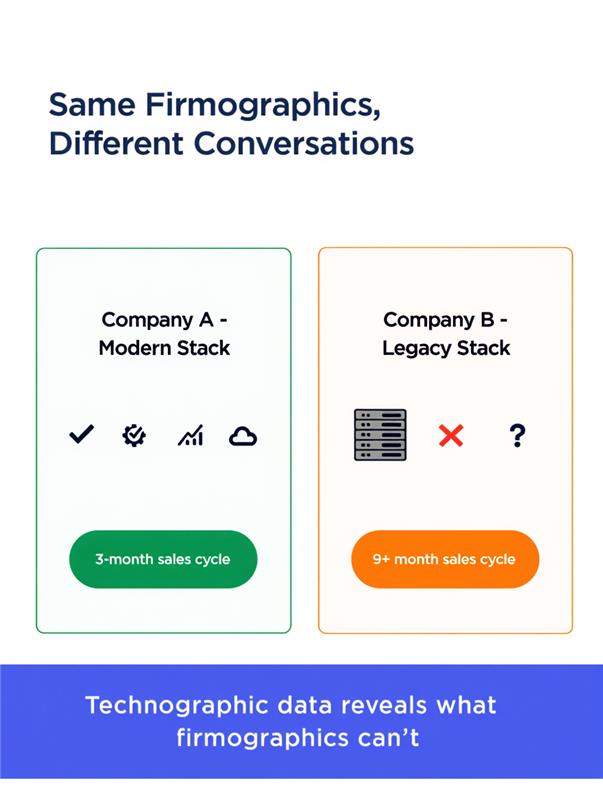
Two companies. Same industry. Same headcount. Same revenue band. Same geographic market.
One closes in 47 days. The other goes dark after three calls and never comes back.
If you asked most B2B marketing teams why, they would struggle to answer using the data they typically collect. Both accounts looked identical on paper or more precisely, in the CRM. Same industry vertical. Same size filter. Same ICP criteria ticked.
What they did not know before reaching out: one company ran a modern, cloud-native stack with three tools that integrated directly with the product they were selling. The other was running 12-year-old on-premises software, had no budget cycle alignment, and had just renewed their existing vendor for two more years.
Firmographic data put both companies on the same list. Technographic data would have separated them in under 30 seconds. This is exactly the gap that firmographic and technographic data together are designed to close.
This is not a story about one data type being better than the other. It is a story about what happens when teams use only one and treat it as complete.
1. What Each Data Type Actually Tells You
Most definitions of these two data types stop at the surface. Here is what they reveal when used by a team that knows what to look for.
Firmographic data
Firmographic data describes the structural characteristics of a company. Industry classification, employee count, annual revenue, geographic location, ownership structure, growth stage. It is the B2B equivalent of demographics for individuals.
What it is good at: telling you whether a company fits the profile of the customers you have already won. If your best customers are mid-market financial services companies with 250 to 500 employees in North America, firmographic data finds more companies that look like them.
What it cannot tell you: whether those companies are ready to buy, whether they are already using a competing product, whether their tech environment is compatible with yours, or whether their buying process involves a committee of twelve people who have never agreed on anything.
Technographic data
Technographic data describes what a company runs the software, platforms, infrastructure, and tools that power its operations. CRM systems, marketing automation, cloud providers, security software, analytics tools, communication platforms.
What it is good at: telling you whether a company is operationally compatible with your product, whether they are using a competitor you could displace, whether their tech maturity suggests they are ready for what you sell, and critically whether the timing is right based on adoption patterns and renewal cycles.
What it cannot tell you in isolation: whether the company is the right size, the right industry, or has the budget to do anything about it. A startup running Salesforce is not the same prospect as an enterprise running Salesforce.
The simplest framing:
Firmographic data confirms fit. Technographic data confirms readiness. You need both but in that order.
2. The False Positive Trap Nobody Talks About
Firmographic filters create false positives at scale. Every B2B team knows this from experience, even if they do not have language for it. You build a target list of 2,000 companies that match your ICP on paper. Sales works through 400 of them. Maybe 60 responds. Maybe 15 qualify properly. The rest were technically correct firmographic matches but were never actually good prospects.
Technographic data cuts that false positive rate significantly because it eliminates companies that look right structurally but are wrong operationally. A company with 400 employees in the right industry becomes a far weaker prospect if they just renewed a competing contract, or if their infrastructure is incompatible with your deployment model.
The false positive cost is not just time.
When sales reps spend 60 percent of their prospecting hours on companies that firmographics said were right but technographics would have eliminated, the cost shows up in quota attainment not in the data report. It is invisible damage.
Technographic data also creates its own false positives, though fewer teams encounter this problem because technographic coverage is thinner. A company flagged as using a specific platform may have deprecated it six months ago. This is the data decay problem, and it affects technographic data much faster than firmographic data.
3. Data Decay: The Hidden Cost
This is the difference between the two data types, and it is the one that causes the most operational problems for teams who buy both without understanding it.
Firmographic data is relatively stable. A company’s industry classification does not change. Its headquarters location changes infrequently. Revenue and headcount shift, but usually gradually and in one direction at a time.
Technographic data decays much faster. Companies swap CRM platforms. They migrate from on premises to cloud. They sunset tools after failed implementations. They adopt new platforms without decommissioning old ones, creating a data footprint that reflects history rather than current state.
| Data Attribute | Typical Decay Rate | What Triggers Change | Review Cadence Needed |
|---|---|---|---|
| Industry vertical | Very slow - 2 to 5 years | Pivot, merger, or acquisition | Annual |
| Employee headcount | Moderate - 6 to 18 months | Hiring, layoffs, restructuring | Quarterly |
| Annual revenue | Moderate - 6 to 12 months | Market conditions, growth stage | Semi-annual |
| HQ location | Slow - 2 to 4 years | Relocation, expansion, remote shift | Annual |
| CRM platform | Fast - 12 to 24 months | Vendor switch, M&A, budget cut | Quarterly |
| Marketing automation | Fast - 12 to 18 months | Stack consolidation, dissatisfaction | Quarterly |
| Cloud infrastructure | Moderate to fast - 18 months | Migration, cost optimization | Semi-annual |
| Security/compliance tools | Fast - 6 to 18 months | Incident, compliance requirement | Quarterly |
The practical implication: if you are sourcing technographic data from a provider who refreshes records annually, you are making outreach decisions based on a tech stack that may no longer exist. The 90-day refresh standard for technographic data is not arbitrary it reflects how quickly that data becomes actionable versus misleading.
4. What a Tech Stack Actually Tells You About Buying Behaviour
This is the insight that separates teams who use technographic data as a filter from teams who use it as intelligence.
A company running Salesforce, Outreach, Gong, and Tableau is telling you something specific about how it operates. It has a structured sales process. It values call recording and coaching. It makes data-driven decisions. It has already invested in a modern GTM stack, which means it is more likely to have budget approved for additional tools and a procurement process that moves faster than a company evaluating its first CRM.
A company running a legacy CRM, no marketing automation, and no analytics tooling is also telling you something that any deal will involve more internal selling than the deal itself. Somebody at that company must convince leadership to invest in digital infrastructure before your product becomes relevant. That is a 9-month sales cycle, minimum.
What specific tools signal about buying behaviour
| Technology Signal | What It Suggests About the Buyer | Sales Implication |
|---|---|---|
| Salesforce CRM | Structured sales process, data-driven ops, above-average tech budget | Shorter evaluation cycle, procurement-ready |
| HubSpot CRM | Growth-stage company, marketing-led motion, ROI-conscious buying | Needs clear ROI proof, marketing champion key |
| On-premises infrastructure | Risk-averse buyer, long approval cycles, IT gatekeeping | Expect 6 to 12-month sales cycle minimum |
| AWS/Azure/GCP (cloud-native) | Modern ops, faster decision-making, compatibility likely | Lead with integration story and speed of deployment |
| No marketing automation | Early-stage or underfunded marketing function | Education sale longer nurture required |
| Competitor's tool (active user) | Entrenched, switching cost is a real objection | Lead with displacement case study and TCO comparison |
| Competitor's tool (recent install) | Honeymoon period or timing for displacement | Nurture and revisit at renewal window |
None of this intelligence exists in firmographic data. Two companies with identical firmographic profiles can be completely different sales conversations depending on their tech environment.
5. The Correct Sequence for Using Both in a Real Workflow
This is where most teams go wrong not in having both data types, but in applying them at the wrong stage.
Step 1 - Firmographic filtering: build the universe
Start with firmographic data to define the total addressable market. Industry, company size, revenue band, geography. This is your first filter the one that eliminates companies that are fundamentally not a fit regardless of what tools they run. A company with 10 employees is not going to buy an enterprise data platform, regardless of their tech stack.
Poor execution can limit the value of technographic insights.
Step 2 - Technographic filtering: qualify within the universe
Once you have a firmographic-filtered list, apply technographic criteria to identify the highest-priority accounts within it. Which companies are running tools that indicate readiness? Which are using a competitor you have a strong displacement case against? Which have the infrastructure compatibility that makes your product viable without a six-month implementation project?
This step typically reduces a 2,000-company firmographic list to 400 to 600 accounts worth serious outreach attention. That is not a bad thing it means your sales team spends time where the probability of conversion is materially higher.
Step 3 - Intent data: identify who is active right now
The third layer is intent data behavioural signals that show which accounts within your qualified list are actively researching solutions in your category. A company that is a perfect firmographic and technographic fit but has no active buying intent is a nurture target. One showing buying intent is a priority outreach target this week.
Most teams skip straight from step one to outreach. The teams that run all three steps consistently outperform on conversion rate and sales cycle length not because they have better salespeople, but because they are reaching the right people at the right time with context that makes the first conversation relevant.
6. Side-by-Side: What Each Data Type Covers
| Attribute | Firmographic Data | Technographic Data |
|---|---|---|
| Primary question answered | Who is this company? | How does this company operate? |
| Best used for | Building target account lists, ICP definition, territory planning | Qualifying accounts, prioritizing outreach, competitive displacement |
| Data sources | Business registries, public filings, company databases | Web crawls, partner integrations, human verification |
| Decay rate | Slowannual refresh usually sufficient | Fastquarterly refresh minimum for reliability |
| Coverage | Broadmost company types covered | Narrowerdepth varies significantly by provider |
| Sales cycle impact | Determines if you should call | Determines when to call and what to say |
| False positive risk | High without technographic layer | Lower but decays fast without refresh |
| Compliance complexity | Lowcompany-level data only | Lowcompany-level data, not personal |
Key Takeaways
- Firmographic data tells you who fits. Technographic data tells you who is ready. Apply them in that sequence, not simultaneously.
- The false positive trap is the most expensive problem in B2B targeting technographic data eliminates most of it before sales ever picks up the phone.
- Technographic data decays 2 to 3 times faster than firmographic data. A provider refreshing records annually is giving you a historical record, not a current one.
- A company’s tech stack reveals buying behaviour, risk tolerance, and sales cycle length none of which appear in any firmographic field.
- Intent data is the third layer that separates accounts worth calling this week from accounts worth nurturing this quarter.
- The ROI of combining both data types shows up in sales cycle length and conversion rate not in list size.
Frequently Asked Questions
Neither is more important in absolute terms. Firmographic data is the first filter it eliminates companies that are fundamentally not a fit. Technographic data is the second filter it identifies which of the remaining companies are operationally ready and compatible. Teams that only use firmographic data build large lists with high false positive rates. Teams that only use technographic data target operationally compatible companies that may be too small, the wrong industry, or outside their territory.
At a minimum, quarterly. Companies change tools, migrate platforms, and sunset software faster than most teams expect. Technographic data that is 12 months old can misrepresent a prospect’s current stack entirely particularly in fast-moving categories like marketing automation, cloud infrastructure, and sales engagement tools. For high-priority accounts, monthly verification is worth the investment.
Some providers track adoption timing and estimated contract windows, but this data is inferred rather than confirmed. It is a useful signal for prioritizing outreach, not a confirmed renewal date. The safer use case is identifying accounts that are showing research behaviour around alternatives which combines technographic data with intent signals for a stronger timing indicator.
Yes, when collected at the company level. Technographic data describes organizational technology usage, not individual behaviour or personal data. It becomes a compliance consideration only when combined with individual contact records, at which point the standard GDPR and CCPA requirements for personal data processing apply.
Demographic data describes individual-level characteristics job title, seniority, department, years of experience. Firmographic data describes company-level characteristics size, industry, revenue, location. In B2B targeting, both are used together: firmographics to qualify the account, demographics to identify the right person within that account to reach.

Conclusion
The difference between firmographic and technographic data is not really a question of which one to use. Every B2B team serious about targeting precision needs both. The more useful question is understanding what each one can and cannot tell you and where the gaps appear when you rely on one without the other.
Firmographic data builds the map. Technographic data marks where the real opportunities sit within it. And the teams who understand the data decay problem, the false positive trap, and the correct sequence for applying each type are the ones whose sales teams spend their time on calls that were worth making not on accounts that looked right until someone picked up the phone.
If your current targeting relies heavily on firmographic filters and your conversion rates from list to qualified opportunity are not where you need them to be, the missing layer is almost always technographic
Right Pace Techmedia Editorial Team
Right Pace Techmedia editorial team comprises B2B growth specialists and campaign strategists with over 7 years of hands-on experience delivering measurable pipeline results for globally recognized technology brands including Oracle, SAP, Salesforce, Siemens, and Lenovo. Having engineered over 1.8 million verified leads across lead generation, account-based marketing, data intelligence, and demand generation programs, our writers draw from real campaign outcomes not borrowed theory. Every article published on this blog reflects practitioner-level knowledge, reviewed by senior professionals who have managed complex B2B campaigns across industries, geographies, and buying committee structures. We write what we know because we’ve lived it.
Our Latest Bolgs

Firmographic and Technographic Data for B2B SaaS ICP
Firmographic Data How to Use Firmographic and Technographic Data to Define Your ICP for B2B SaaS Quick Answer To build an ICP
Firmographic Segmentation for ABM
Firmographic Data How to Use Firmographic Segmentation for ABM Campaigns That Actually Convert Quick Answer Firmographic segmentation for ABM is the process
Firmographic vs Technographic Data: What B2B Teams Get Wrong About Both
Firmographic Data Firmographic vs Technographic Data: What B2B Teams Get Wrong About Both Quick Answer: Firmographic data tells you who a company


